NAACCReview

The Cancer Registry Rationale

When Ide Mills first learned about the Cancer Support Community Registry, she jumped at the chance to participate. Mills, who has stage 4 lung cancer, went online at cancerexperienceregistry.org to answer demographic questions and in-depth queries about her experience with her illness, such as what worried her the most and what her everyday challenges were in living with her disease.

The registry collects information about the social and emotional experiences of cancer patients and their caregivers. Then, Cancer Support Community, a nonprofit patient advocacy group, uses the data to improve its own programs and to help enhance research and care programs offered by the health care community.

For IDE MILLS, joining a patient registry was not just about helping researchers gather data, but about feeling like part of a community. - PHOTO BY DIANA LEE For IDE MILLS, joining a patient registry was not just about helping researchers gather data, but about feeling like part of a community. – PHOTO BY DIANA LEE

For Mills, of Maplewood, New Jersey, filling out the online form represented a chance to help someone else have a better cancer journey, but since then, the registry has come to mean even more to her. Mills not only participates actively in the registry, but is an advisor on one of its panels. She and other members of this community contribute to the study of trends, share their thoughts about research findings and help design programs that meet the needs of patients and caregivers.

“It’s important for patients to know they are not alone, and cathartic to share one’s story,” Mills says. “Most important, being a part of a larger community bonded by similar life experiences is invaluable.”

Registries are designed for the collection of data, but, unlike clinical trials, they are not designed to test drugs under controlled conditions; rather, registries look at established standards of care and choices made by patients and their doctors during the normal course of treatment. This means that registries answer different questions than clinical trials do. While a trial estimates the safety and/or effectiveness of a treatment, a registry determines whether a new treatment is being appropriately used in a population group and whether the benefits found in clinical trials are consistent with what is being observed in a more diverse population. In some cases, information is collected about a specific disease or clinical situation, rather than a specific therapy. Registries can also look for trends in cancer incidence that might be addressable through changes in health care practices. …


Read Full Article (Excerpt of Article from CureToday.com)


Rebecca Cassady, RHIA, CTR
Rebecca Cassady, RHIA, CTR Director
Desert Sierra Cancer Surveillance Program Region 5 of Cancer Registry of Greater California
(NAACCR Committee Member)

‘The Cancer Registry Rationale’ illustrates the impact of cancer registries on public health and patient care. Utilizing the data that is obtained can provide the impetus to evaluate treatment patterns, influence cancer prevention measures and provide resources for scientific analyses. Specialized cancer registries have been developed to provide additional focus and generate support resources to improve patient outcomes. The continuous work of the cancer surveillance community contributes to the overarching goal of reducing the burden of cancer on society and improving the quality of life for cancer patients.


The opinions expressed in this article are those of the authors and may not represent the official positions of NAACCR.

Cancer in context: 37 years collected data reveals eye-opening trends

Prostate and lung cancer have been the No. 1 and 2 cancers among men. Stomach cancer, the third leading cause of cancer deaths worldwide, has been on a steady decline among Koreans and Japanese. Black men had the highest overall rates of cancer. Thyroid cancer — which is relatively treatable — has been on the rise, and women are about three times more likely to contract it than men.

These are a few of the notable nuggets in the most recent Cancer in Los Angeles County: Trends by Race/Ethnicity 1976-2012, a book released on Aug. 15. The report card includes every cancer diagnosis in the region over the past 37 years — more than 1.3 million. With easy-to-read charts, the book divides L.A.’s population into 11 ethnic and racial groups to highlight the fact that cancer risk is a result of genetics, environment and behavior.

“Not only are we telling people what has happened to others in the past, but we are also helping them understand their own future cancer risk,” said Dennis Deapen, the report’s senior author and a professor of clinical preventive medicine at the Keck School of Medicine of USC. “The majority of cancer in Los Angeles is preventable: You can reduce the risk yourself. Let this be a reminder to get appropriate checkups to help identify any cancer early.”

gr49429_web-600x400The Los Angeles Cancer Surveillance Program (CSP), a state-mandated database managed by Keck Medicine of USC and the USC Norris Comprehensive Cancer Center, provides scientists everywhere with essential statistics on cancer. About two publications each day cite this large and diverse databank as a resource, said Deapen, who directs the program.

USC’s report card provides evidence of how environmental and lifestyle choices can alter one’s cancer risk. For instance, Asian women living in Los Angeles experience higher and continuously rising breast cancer risk compared to their counterparts living in Asia. That’s because breast cancer is more prevalent in developed countries with westernized lifestyles, said Lihua Liu, lead author and an assistant professor of clinical preventive medicine at the Keck School of Medicine. ….


Read Full Article (Excerpt of Article by USC News)


Assistant Professor
Lihua Liu, PhD., Assistant Professor, Los Angeles Cancer Surveillance Program (NAACCR Committee Member)

Based on over 1.3 million cancer records diagnosed over 37 years, the Los Angeles Cancer Surveillance Program recently released their third monograph on cancer trends in Los Angeles County. Aimed at the general public, “Cancer in Los Angeles County: Trends by Race/Ethnicity, 1976-2012” provides rich information on racial/ethnic specific cancer incidence trends for 24 cancer types among 11 racial/ethnic populations for the large, highly diverse county of Los Angeles. The report highlights striking disparities in cancer risk among different racial/ethnic populations by cancer type, which measures the potential for reduction in cancer burden, if the lowest rates were to be achieved by all. The dramatic changes in cancer trends over the study period within the same populations underline the important public health message that cancer risk is largely modifiable by non-genetic (i.e., behavioral and lifestyle) factors.


The opinions expressed in this article are those of the authors and may not represent the official positions of NAACCR.

Rate of metastatic prostate cancer is not increasing

contact

Millions of Americans may have heard on the news last week that metastatic prostate cancer was increasing dramatically in the United States. However, national data demonstrate that, in fact, the rates are not changing. Using data collected by cancer registries across the United States, the North American Association of Central Cancer Registries (NAACCR, Inc.) found that rates of metastatic prostate cancer rates are stable.

In a newly released study, “Increasing incidence of metastatic prostate cancer in the United States (2004–2013)” which was e-published in the journal Prostate Cancer and Prostatic Diseases on July 19, 2016, the authors present findings inconsistent with other studies of prostate cancer trends. Prostate cancer incidence and mortality have been declining for many years, and recent rates of metastatic disease are stable, not increasing as the authors’ state in their paper.

Figure 1Figure 1

The reason for the discrepancy between this study and other published literature is that the wrong measure was used for incidence. The authors equated a change in the count of metastatic prostate cancer to an increase in risk of metastatic prostate cancer. But counts of cases do not answer public health questions about risk and using counts can result in misleading conclusions. To compare risk of prostate cancer in two populations or the same population over time, we must use age-adjusted incidence rates.

Figure 1, using NAACCR’s Cancer in North America (CiNA), a population-based dataset covering 97% of United States population including data from the Centers for Disease Control and Prevention (CDC) National Program of Cancer Registries (NPCR) and National Cancer Institute (NCI) Surveillance, Epidemiology and End Results (SEER), shows that metastatic prostate cancer incidence rates, the true measure of risk, were virtually unchanged between 2004 and 2013. Use of PSA for prostate cancer screening is now no longer recommended and fewer men are electing to be screened by PSA. Consequently, fewer asymptomatic, local stage cases are being diagnosed, as seen in the top line of the graph.

We also note that the data set used by the authors was not population-based and represents a subset of the total cases of prostate cancer in the US. The authors used the National Cancer Data Base (NCDB), which is not a population-based sample but a subset of the US cancer cases collected from American College of Surgeons (ACoS) approved hospitals. An estimated 30-40% of the total cancer cases in the US are diagnosed in non-ACoS approved facilities. ACoS approved hospitals tend to be large facilities located in urban settings and their patients may have distinct differences from the population at risk of developing prostate cancer.

It is not unusual for researchers to have differing interpretations of the same data. But it is imperative that proper epidemiologic measures are used in public health research. NAACCR, along with its partners the American Cancer Society (ACS), CDC, and NCI are working together to clarify the issues raised by this methodology further delineating our concerns about the authors’ representation and interpretation of these data.


Referenced Study
Increasing incidence of metastatic prostate cancer in the United States (2004-2013)
(The linked report was published on PubMed)


Abstract

Background:
Changes in prostate cancer screening practices in the United States have led to recent declines in overall incidence, but it is unknown whether relaxed screening has led to changes in the incidence of advanced and metastatic prostate cancer at diagnosis.
Methods:
We identified all men diagnosed with prostate cancer in the National Cancer Data Base (2004-2013) at 1089 different health-care facilities in the United States. Joinpoint regressions were used to model annual percentage changes (APCs) in the incidence of prostate cancer based on stage relative to that of 2004.
Results:
The annual incidence of metastatic prostate cancer increased from 2007 to 2013 (Joinpoint regression: APC: 7.1%, P<0.05) and in 2013 was 72% more than that of 2004. The incidence of low-risk prostate cancer decreased from years 2007 to 2013 (APC: -9.3%, P<0.05) to 37% less than that of 2004. The greatest increase in metastatic prostate cancer was seen in men aged 55-69 years (92% increase from 2004 to 2013).
Conclusions:
Beginning in 2007, the incidence of metastatic prostate cancer has increased especially among men in the age group thought most likely to benefit from definitive treatment for prostate cancer. These data highlight the continued need for nationwide refinements in prostate cancer screening and treatment.Prostate Cancer and Prostatic Diseases advance online publication, 19 July 2016; doi:10.1038/pcan.2016.30.


The opinions expressed in this article are those of the authors and may not represent the official positions of NAACCR.

Comprehensive 2016 Ontario cancer statistics report released by Cancer Care Ontario

MPH, Knowledge Dissemination & Evaluation Specialist


Zeinab El-Masri, MPH, Knowledge Dissemination & Evaluation Specialist, Surveillance and Ontario Cancer Registry

Cancer Care Ontario, a provincial cancer agency in Canada, has compiled more than 30 years of data from the Ontario Cancer Registry to produce the Ontario Cancer Statistics 2016 report.

In this first comprehensive look at the state of cancer in Ontario, OCS 2016 provides a clear picture of cancer, focusing on the incidence, mortality, survival and prevalence of the disease in Canada’s largest province.

For the first time, statistics on clinically relevant indicators for select cancers, using stage at diagnosis, cancer histology and biomarker data are also reported.

ocsreport2016_coverpage_jm01-232x300Highlights from the report were presented at the NAACCR 2016 Annual Conference and include:

  • One in two Ontarians will develop cancer in their lifetime and one in four will die from it;
  • Approximately 85,648 new cases of cancer are expected to be diagnosed in Ontario in 2016, which is almost triple the number of cases that were diagnosed in 1981 (29,649 cases), largely attributed to an aging population and population growth;
  • Cancer mortality rates are declining and survival for nearly all cancer types is increasing in the province;
  • The five-year relative survival ratio for all cancers combined in Ontario is 63 per cent;
  • There are now more people living in Ontario with a diagnosis of cancer than there were 20 years ago—an estimated 362,557 people as of January 1, 2013 (or about 2.7 per cent of the Ontario population).

OCS 2016 is a definitive source for cancer surveillance information for Ontario and is expected to be published every two years.

For more information, please email us at surveillance@cancercare.on.ca.


View the Ontario Cancer Statistics 2016 report (The linked report was developed by Cancer Care Ontario)


Overview

Ontario Cancer Statistics 2016 is a report that comprehensively describes the burden of cancer in Ontario. It uses data from the Ontario Cancer Registry to provide a clear picture of cancer in this province, focusing on the incidence, mortality, relative survival and prevalence of this disease. This information is intended to support decision-makers, the public health community, healthcare providers, researchers and others in planning, investigating, measuring and monitoring population-based cancer control efforts.

The report is comprised of five key chapters that can be downloaded individually. Also available for use is an infographic summary of the key report highlights and pre-populated PowerPoint slides with figures from the report.


The opinions expressed in this article are those of the authors and may not represent the official positions of NAACCR.

The Affordable Care Act and Cancer Stage at Diagnosis Among Young Adults

Strategic Director


Xuesong Han, Strategic Director, Health Policy & Healthcare Delivery Research, American Cancer Society

With millions of Americans gaining insurance through the Affordable Care Act, we can expect to see a change in the distribution of insurance status among cancer patients. For example, a recent study published in Cancer (Parsons 2016) identified an increase in the rate of young adult cancer patients with private insurance following the implementation of the ACA dependent care provision in 2010. With the full implementation of the ACA expanding Medicaid eligibility in more than half of the states and creating marketplaces nationwide in 2014, I expect to see an increase in Medicaid and private insurance coverage, along with a decrease in uninsured rate, among cancer patients.

Whether this increase in insurance rate translates to increased access to cancer care and improved cancer outcomes remains to be seen and is important to monitor for cancer control. In the coming years, I would not be surprised if we see an increase in cancer screening uptake and a shift to earlier stage of cancer diagnosis, more cancer patients being able to receive timely treatment, and eventually improved survival and quality of life, especially among those with a low- to medium-income and residing in the states that adopted Medicaid expansion. As a result, we may see a narrowing of the disparities in cancer outcomes by race/ethnicity and socioeconomic status in the coming years.


The Affordable Care Act and Cancer Stage at Diagnosis Among Young Adults (The abstract below is from JNCI Journal of the National Cancer Instititute)


Abstract

The Affordable Care Act-dependent coverage expansion provision implemented in 2010 allows young adults to be covered under their parents’ health insurance until age 26 years, and millions of young adults have gained insurance as a result. The impact of this policy on cancer patients has yet to be determined. Using 2007 to 2012 data from 18 registries of the Surveillance, Epidemiology, and End Results Program, comparing cancer patients age 19 to 25 years to a control group of patients age 26 to 34 years who were not affected by the provision, we observed a 2.0 (95% confidence interval [CI] = 0.7 to 3.4) percentage point decrease in uninsured rate and a 2.7 (95% CI = 0.6 to 4.8) percentage point increase in diagnosis at stage I disease for patients age 19-25 years. Further analyses by specific cancer site revealed that the statistically significant shifts were confined to carcinoma of cervix (21.2, 95% CI = 9.6 to 32.7 percentage points) and osseous and chondromatous neoplasms (14.4, 95% CI = 0.3 to 28.5 percentage points), which are detectable by either screening or clinical manifestation. These early observations suggest the policy has had positive benefits in cancer outcomes.


The opinions expressed in this article are those of the authors and may not represent the official positions of NAACCR.

Addressing overdiagnosis in thyroid cancer

rsherman-mini

Recinda L Sherman, MPH, PhD, CTR Program Manager, Data Use & Research North American Association of Central Cancer Registries
(217) 698-0800 x 6; rsherman@naaccr.org

While there are some well established carcinogens, for example tobacco, the largest risk for most cancers is age. And while we understand that individual-level lifestyle factors have a significant impact on cancer incidence, like diet; it is also clear that contextual factors such as poverty and regional policies influence cancer risk and outcomes. We can rightfully highlight public health successes in tobacco cessation and subsequent decline in tobacco-related cancers, as well as other tobacco-affiliated disease. But because cancer has a long latency period and is multicausal, primary prevention efforts are hampered by our limited understanding of what causes most cancers.

This places additional reliance on secondary prevention efforts, primarily screening and effectively treating early stage cancers, to address the burden of cancer. For some cancers, there are effective, population-based screenings, such as for cervical and colorectal cancer. And new advances in low-dose CT scanning are important secondary prevention tools for lung cancer by screening high-risk individuals, based on age and smoking history. Other important secondary prevention efforts include improvements in diagnostic screening tools, intended to screen symptomatic individuals versus the general public, which are also important in influencing stage-shift.

But the focus on detecting early stage cancers is not universally positive and is leading to overdiagonosis, particulary for prostate, breast, melanoma, and thyroid cases. Overdiagnosis is when an asymptomatic cancer is identified through medical technology, but the cancer is either non-invasive or so slow-growing that it would never cause medical problems or be life-threatening. In some cases, an asymptomatic, malignant tumor can regress spontaneously—without medical treatment. The diagnosis of cancer is a frightening event, and, instead of postively impacting mortality, treating overdiagnosed cancers with invasive surgery, radiation, and/or chemotherapy can lead to detrimental side effects. Treatment is uneccessary for overdiagnosed cancers and can lead to physical, psychological, and economic harms.

How do we balance the benefits of cancer screening with the harms of overdiagnosis?

One approach is to remove the label of cancer from the low-risk (overdiagnosed) conditions. For example, thyroid cancer incidence has been on the rise in North American for decades, but mortality rates have remained stable—a discrepancy indicative of high percentages of overdiagnosis. Last week’s article in JAMA Oncology (abstract below) presents a recent revision in nomenclature for an indolent thyroid carcinoma, encapsulated follicular variant of papillary thyroid carcinoma (EFVPTC), to a non-malignant condition. Currently most patients with EFVPTC are treated as having an aggressive thyroid cancer. After conducting an international, retrospective study of EFVPTC patients, a panel of endocrinologists 1) reclassified EFVPTC to a non-malignant condition: non-invasive follicular thyroid neoplasms with papillary-like nuclear features or NIFTP; and 2) developed consensus-based, histopathologic diagnostic criteria to appropriately distinguish NIFTP from malignant thyroid cancer. The study authors have coordinated international support for the proposed declassification from professional societies and are working to publicize both the name and diagnostic criteria among clinicians and pathologists.

What does this mean for cancer surveillance?

We will see a decline in thyroid cancer incidence for cases diagnosed in 2016 forward—how rapid a decline will depend upon how quickly the new diagnostic criteria are adopted by clinicians and how our coding system adapts to reflect the new designation. Below is a rough assessment of the changes we might see. Using histology codes 8335/3 Encapsulated follicular carcinoma, 8343/3 Encapsulated papillary carcinoma, and 8340/3 Papillary carcinoma, follicular variant to approximate NIFTP, we see a 30% decrease in thyroid cancer for diagnosis year 2013 due to the change in classification. And while thyroid incidence is still statistically increasing an average of 5.7% per year, based on this NIFTP estimate, more specific codes for NIFTP may result in a further decline in thyroid cancer incidence trends.

thyroid
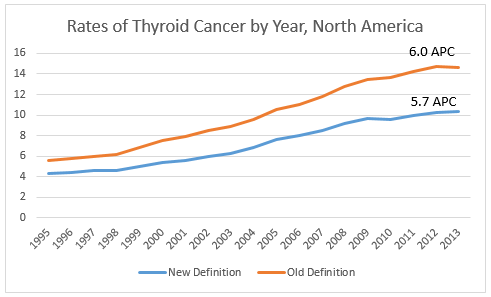
In North America, reportablility follows the guidelines established by the WHO. We will be monitoring WHO “blue books” to see if this reclassification is officially adopted. In order to effectively track the burden of thyroid cancer, the cancer surveillance community will need to ensure our current classification system can accommodate this change, develop guidelines for assessing thyroid cancer trends over time, and educate the public about what is driving the significant drop in thyroid cancer incidence we will see in the new few years.


Nomenclature Revision for Encapsulated Follicular Variant of Papillary Thyroid Carcinoma (The abstract below is from JAMA Oncology)


Abstract

Importance
Although growing evidence points to highly indolent behavior of encapsulated follicular variant of papillary thyroid carcinoma (EFVPTC), most patients with EFVPTC are treated as having conventional thyroid cancer.

Objective
To evaluate clinical outcomes, refine diagnostic criteria, and develop a nomenclature that appropriately reflects the biological and clinical characteristics of EFVPTC.

Design, Setting, and Participants
International, multidisciplinary, retrospective study of patients with thyroid nodules diagnosed as EFVPTC, including 109 patients with noninvasive EFVPTC observed for 10 to 26 years and 101 patients with invasive EFVPTC observed for 1 to 18 years. Review of digitized histologic slides collected at 13 sites in 5 countries by 24 thyroid pathologists from 7 countries. A series of teleconferences and a face-to-face conference were used to establish consensus diagnostic criteria and develop new nomenclature.

Main Outcomes and Measures
Frequency of adverse outcomes, including death from disease, distant or locoregional metastases, and structural or biochemical recurrence, in patients with noninvasive and invasive EFVPTC diagnosed on the basis of a set of reproducible histopathologic criteria.

Results
Consensus diagnostic criteria for EFVPTC were developed by 24 thyroid pathologists. All of the 109 patients with noninvasive EFVPTC (67 treated with only lobectomy, none received radioactive iodine ablation) were alive with no evidence of disease at final follow-up (median [range], 13 [10-26] years). An adverse event was seen in 12 of 101 (12%) of the cases of invasive EFVPTC, including 5 patients developing distant metastases, 2 of whom died of disease. Based on the outcome information for noninvasive EFVPTC, the name “noninvasive follicular thyroid neoplasm with papillary-like nuclear features” (NIFTP) was adopted. A simplified diagnostic nuclear scoring scheme was developed and validated, yielding a sensitivity of 98.6% (95% CI, 96.3%-99.4%), specificity of 90.1% (95% CI, 86.0%-93.1%), and overall classification accuracy of 94.3% (95% CI, 92.1%-96.0%) for NIFTP.

Conclusions and Relevance
Thyroid tumors currently diagnosed as noninvasive EFVPTC have a very low risk of adverse outcome and should be termed NIFTP. This reclassification will affect a large population of patients worldwide and result in a significant reduction in psychological and clinical consequences associated with the diagnosis of cancer.


The opinions expressed in this article are those of the authors and may not represent the official positions of NAACCR.

Cancer kills Kentuckians at highest rate (Update)

UPDATED 3/28/16

Watch Why cancer is so hard to fight in rural Kentucky on PBS. See more from PBS NEWSHOUR

In the end, lung cancer left Jerome Grant voiceless, a breathing tube in his windpipe.

He could say nothing when his wife Dawn spoke her last words to him: “I love you, you know that?”

He gave her a thumbs up. Then he closed his eyes and was gone.

The 52-year-old Louisville man was one of about 10,000 Kentuckians a year taken by cancer in a state where the disease consistently kills at the highest rate in the nation. Experts say the biggest culprit is lung cancer, which strikes and kills Kentuckians at rates 50 percent higher than the national average. But Kentucky’s death rates also rank in the Top 10 nationally for breast, colorectal and cervical cancers.

“It’s really been driven by three major things: obesity, smoking and lack of screening,” said Louisville gastroenterologist Dr. Whitney Jones. “Our state is completely inundated with risk factors.”

Smoking, a stubborn vestige of the state’s tobacco legacy, is at the root of most lung cancers, although other environmental causes such as radon play a part as well. Obesity, a risk factor for several cancers, also hits Kentucky hard, afflicting more than three in 10 residents. Poverty, lack of education and doctor shortages mean residents are less likely to get screenings that can find cancer early – or effective treatment. …


Read Full Article (Excerpt of Article by Laura Ungar of Courier Journal)


tucker-150x150
Thomas C. Tucker, PhD, MPH, Associate Director for Cancer Control and Director of the Kentucky Cancer Registry University of Kentucky Markey Cancer Center (NAACCR Steering Committee Chair, Past-President)


Unfortunately, Kentucky has the highest overall cancer incidence and mortality rates in the country compared to all other U.S. states and the District of Columbia. Laura Ungar is a staff writer for the Louisville Courier Journal newspaper. In a recent article titled “Cancer Kills Kentuckians at the Highest Rate”, she makes a strong case that the unusually high cancer burden in Kentucky is related to the high rates of poverty and low educational attainment in the state. But, how are poverty and literacy implicated in the excessively high cancer burden in Kentucky? The answer to this question is not simple. For many years we have observed that cancer risk behaviors such as smoking or not being screened are closely tied to high rates of poverty and low educational attainment. Population-based measures of poverty and literacy are often operationalized as the proportion of the population living below the federal poverty level or the proportion of the population over age 25 with a high school degree. These two measures of socioeconomic destress are also highly correlated. In Kentucky, especially in the Appalachian area of the state, these measure are unusually high. In the U.S. only 14% of the population live below the federal poverty level. In one of the Kentucky Appalachian counties, more than 42% of the population are living below the federal poverty level. In the U.S. more than 85% of the population over age 25 have a high school degree. In some counties in the Appalachian region on Kentucky just over half of the population have a high school degree. Consistent with the association between these measures and increased risk behaviors, the Appalachian region of Kentucky has higher rates of smoking and extraordinarily high rates of lung cancer incidence and mortality.

Lung cancer is clearly the major contributor to the unusually high cancer incidence and mortality rates in Kentucky. In the U.S. lung cancer accounts for 14% of all the new cases occurring annually and 18% of all cancer deaths. In Kentucky, lung cancer accounts for 28% of all new cases occurring annually and well over one third (36%) of all cancer deaths annually. It would be easy to say that the unusually high rates of lung cancer incidence and mortality in Kentucky and especially in the Appalachian area of the state are all due to excessive smoking. However, there are several recent studies that provide strong evidence showing the high rates on lung cancer are not accounted for by smoking alone. To put this issue in context, if a person smokes their risk of lung cancer is 11 to 14 times that of a non-smoker. However, if a person smokes and is also exposed to asbestos, their risk of lung cancer can be 300 times that of a non-smoker. We believe that something like this is accounting for the excessively high lung cancer incidence rates in Appalachian Kentucky. Our own studies have shown that people living in the Appalachian area of Kentucky have elevated levels of arsenic and chromium. Both arsenic and chromium are known lung cancer carcinogens. Therefore, we believe that the excessively high lung cancer incidence rates may be due to the higher rates of smoking in combination with exposure to arsenic and chromium.

Reducing the cancer burden in populations marked by high rates of poverty and low educational attainment can be very challenging. The cancer surveillance program provides tools to identify areas and populations with a high cancer burden. However, to reduce this burden requires a clear understanding of cultural and social barriers, and it requires resources to implement culturally sensitive evidence based interventions programs. We are attempting to do this in Kentucky through our collaborative efforts with partners across the state. By focusing on the areas with the greatest need, we were able to reduce the incidence of colorectal cancer by 24% and the mortality rate by 30% in just seven years. No other state had such a dramatic change in such a short period of time. By continuing to implement culturally sensitive evidence based interventions programs we hope to reduce the cancer burden so it can no longer be said that “Cancer Kills Kentuckians at the Highest Rate”.


The opinions expressed in this article are those of the authors and may not represent the official positions of NAACCR.

Annual Report to the Nation on the Status of Cancer, 1975-2012, featuring

Ryerson_8582ccA. Blythe Ryerson, MPH, PHD, Interim Chief, Cancer Surveillance Branch, Centers for Disease Control and Prevention (NAACCR Committee Member)
(770) 488-2426; ARyerson@cdc.gov

I’m pleased to announce the release of this year’s Report to the Nation, an annual collaborative effort by CDC, NCI, ACS, and NAACCR. This 18th “edition” has CDC as the lead agency; however, its success relies upon the tremendous expertise from senior researchers across all the collaborative organizations. Furthermore, no major cancer surveillance report would be possible without the continued dedication and contributions of the state and regional cancer registry staff collecting the data for analysis.

Print

Despite successful reductions in the occurrence and mortality from the most common cancers, some cancers are showing unfavorable trends. Liver cancer, the special focus of the report, has death rates increasing at the highest rate of all cancer sites among men and women, and liver cancer incidence rates are rising at a rate second only to those of thyroid cancer.

Lower Your Chances

A major risk factor for liver cancer is hepatitis C virus (HCV) infection. About 22% of the most common histological type of liver cancer is attributed to HCV. Because rates of chronic HCV infection are most common among people born 1945-1965, CDC recommends one-time testing for HCV for people born during this time. Those who test positive should be referred for appropriate care and treatment. Other strategies for reducing the burden of liver cancer include promoting hepatitis B vaccination, establishing and implementing public health initiatives aimed at reducing unhealthy behaviors such as smoking and excessive alcohol use, and promoting health eating and physical activity to reduce obesity.

Moderate media interest in the topic helped bring attention to the report, including from U.S. News and World Report and multiple national and statewide media outlets. You can read the whole report here. Take a look at the graphics (free for reposting) at www.cdc.gov/cancer.


Abstract

Background: Annual updates on cancer occurrence and trends in the United States are provided through an ongoing collaboration among the American Cancer Society (ACS), the Centers for Disease Control and Prevention (CDC), the National Cancer Institute (NCI), and the North American Association of Central Cancer Registries (NAACCR). This annual report highlights the increasing burden of liver and intrahepatic bile duct (liver) cancers.

Methods: Cancer incidence data were obtained from the CDC, NCI, and NAACCR; data about cancer deaths were obtained from the CDC’s National Center for Health Statistics (NCHS). Annual percent changes in incidence and death rates (age-adjusted to the 2000 US Standard Population) for all cancers combined and for the leading cancers among men and women were estimated by joinpoint analysis of long-term trends (incidence for 1992-2012 and mortality for 1975-2012) and short-term trends (2008-2012). In-depth analysis of liver cancer incidence included an age-period-cohort analysis and an incidence-based estimation of person-years of life lost because of the disease. By using NCHS multiple causes of death data, hepatitis C virus (HCV) and liver cancer-associated death rates were examined from 1999 through 2013.

Results: Among men and women of all major racial and ethnic groups, death rates continued to decline for all cancers combined and for most cancer sites; the overall cancer death rate (for both sexes combined) decreased by 1.5% per year from 2003 to 2012. Overall, incidence rates decreased among men and remained stable among women from 2003 to 2012. Among both men and women, deaths from liver cancer increased at the highest rate of all cancer sites, and liver cancer incidence rates increased sharply, second only to thyroid cancer. Men had more than twice the incidence rate of liver cancer than women, and rates increased with age for both sexes. Among non-Hispanic (NH) white, NH black, and Hispanic men and women, liver cancer incidence rates were higher for persons born after the 1938 to 1947 birth cohort. In contrast, there was a minimal birth cohort effect for NH Asian and Pacific Islanders (APIs). NH black men and Hispanic men had the lowest median age at death (60 and 62 years, respectively) and the highest average person-years of life lost per death (21 and 20 years, respectively) from liver cancer. HCV and liver cancer-associated death rates were highest among decedents who were born during 1945 through 1965.

Conclusions: Overall, cancer incidence and mortality declined among men; and, although cancer incidence was stable among women, mortality declined. The burden of liver cancer is growing and is not equally distributed throughout the population. Efforts to vaccinate populations that are vulnerable to hepatitis B virus (HBV) infection and to identify and treat those living with HCV or HBV infection, metabolic conditions, alcoholic liver disease, or other causes of cirrhosis can be effective in reducing the incidence and mortality of liver cancer. Cancer 2016. ©2016 American Cancer Society.


Click here to view the report


The opinions expressed in this article are those of the authors and may not represent the official positions of NAACCR.

The effect of multiple primary rules on cancer incidence rates and trends

chrisjohnson-mini
Christopher Johnson, MPH, Epidemiologist, Cancer Data Registry of Idaho (NAACCR Board – Representative-At-Large)


Multiple primary cancers are interesting because they can provide insight into the etiologic role of genes, the environment, and prior cancer treatment on a cancer patient’s risk of developing a subsequent cancer. Over time, the burden of multiple primary cancers has increased as patients are living longer following a diagnosis of cancer.

Cancer registries in the U.S. and the most of Canada use SEER multiple primary rules to count incident cases, while cancer registries in other parts of the world use rules from the International Agency for Research on Cancer and International Association of Cancer Registries (IARC/IACR). Compared to SEER rules, IARC/IACR rules are less complex, have not changed over time, and report fewer multiple primary cancers, particularly cancers that occur in paired organs, at the same anatomic site and with the same or related histologic type. Different rules for registering and reporting multiple primary cancers can make data comparisons between the U.S. and other parts of the world difficult.

SEER*Stat now includes a feature whereby cancer incidence data reported using SEER rules can be analyzed to reflect IARC/IACR rules. In a paper just released by Cancer Causes and Control (see below), we evaluated the effect of SEER and IARC/IACR multiple primary rules on cancer incidence rates and trends using data from the SEER Program. We estimated age-standardized incidence rates and trends (1975–2011) for the top 26 cancer categories using joinpoint regression analysis. Incidence rates were higher using SEER compared to IARC/IACR rules for all cancers combined (3%) and, in rank order, melanoma (9%), female breast (7%), urinary bladder (6%), colon (4%), kidney and renal pelvis (4%), oral cavity and pharynx (3%), lung and bronchus (2%), and non-Hodgkin lymphoma (2%). Differences in incidence rates using the two sets of multiple primary rules were larger for older patients. Trends were similar using both sets of multiple primary rules, with the exception of cancers of the urinary bladder and kidney and renal pelvis.

The choice of multiple primary coding rules affects cancer incidence rates and trends. Entities reporting incidence data using SEER multiple primary rules may want to consider also reporting incidence rates and trends using IARC/IACR rules to facilitate international data comparisons.


Read Full Article (The abstract below is from Springer Link)


Abstract

Purpose
An examination of multiple primary cancers can provide insight into the etiologic role of genes, the environment, and prior cancer treatment on a cancer patient’s risk of developing a subsequent cancer. Different rules for registering multiple primary cancers (MP) are used by cancer registries throughout the world making data comparisons difficult.

Methods
We evaluated the effect of SEER and IARC/IACR rules on cancer incidence rates and trends using data from the SEER Program. We estimated age-standardized incidence rate (ASIR) and trends (1975–2011) for the top 26 cancer categories using joinpoint regression analysis.

Results
ASIRs were higher using SEER compared to IARC/IACR rules for all cancers combined (3 %) and, in rank order, melanoma (9 %), female breast (7 %), urinary bladder (6 %), colon (4 %), kidney and renal pelvis (4 %), oral cavity and pharynx (3 %), lung and bronchus (2 %), and non-Hodgkin lymphoma (2 %). ASIR differences were largest for patients aged 65+ years. Trends were similar using both MP rules with the exception of cancers of the urinary bladder, and kidney and renal pelvis.

Conclusions
The choice of multiple primary coding rules effects incidence rates and trends. Compared to SEER MP coding rules, IARC/IACR rules are less complex, have not changed over time, and report fewer multiple primary cancers, particularly cancers that occur in paired organs, at the same anatomic site and with the same or related histologic type. Cancer registries collecting incidence data using SEER rules may want to consider including incidence rates and trends using IARC/IACR rules to facilitate international data comparisons.


The opinions expressed in this article are those of the authors and may not represent the official positions of NAACCR.

Cancer incidence among Asian American populations in the United States, 2009–2011

paulo-pinheiro
Paulo Pinheiro, MD, MSc, PhD, Associate Professor Epidemiology, University of Nevada Las Vegas (NAACCR Committee Member)

Asian Americans are the fastest-growing racial/ethnic group in the United States. In their newly published manuscript, our colleagues at the University of Nevada Las Vegas estimated detailed incidence rates for 17 cancer sites for the six largest Asian subgroups. They utilized data from SEER and NPCR for 2009-2011 from the 8 states with the largest number of Asians in the US (CA, FL, HI, IL, NJ, NY, TX, and WA). Excellent work has already been published on rates for Asian subgroups by McCracken et al. 2007, Miller et al. 2008, and Gomez et al. 2013, among others. So what’s new about this research? Two main things: one, the coverage of the total US Asian population is 68%, larger than in previous studies, including non-SEER cities with many Asians like Chicago, Houston and New York City; and two, by systematically accounting for Asians with unknown subgroup (Asian-NOS), they produced rates that, for the first time, permit direct comparisons between major Asian subgroups – Chinese, Japanese, South Asian, Korean, Filipino, and Vietnamese- as well as between any given Asian subgroup and other populations such as Whites, Blacks and Hispanics. When NOS cases are excluded, the resulting incidence rates are inevitably underestimated.

Jin et al. imputed Asian subgroup for NOS cases based on age, gender, region of residence, and cancer site. While the assumption of proportional distribution according to these variables may not be perfect, it is certainly a step closer to unbiased final estimates for incidence rates for each Asian subgroup. In their methodology they also took into account that for some Asians groups, e.g. Malay, Indonesian, and others, there are no appropriate race fields available other than NOS.

The analyses showed that Asian Americans have a lower cancer risk than non-Hispanic whites, except for nasopharyngeal, liver and stomach cancers. In comparison to non-Hispanic whites and other Asian subgroups, increased risks were observed for colorectal cancer among Japanese, stomach cancer among Koreans, nasopharyngeal cancer among Chinese, thyroid cancer among Filipinos, and liver cancer among Vietnamese. The unique portrayal of cancer incidence patterns among specific Asian subgroups in this study provides a new baseline for future cancer surveillance research.


Read Full Article (The abstract below is from Wiley Online Library)


Abstract

Cancer incidence disparities exist among specific Asian American populations. However, the existing reports exclude data from large metropoles like Chicago, Houston and New York. Moreover, incidence rates by subgroup have been underestimated due to the exclusion of Asians with unknown subgroup. Cancer incidence data for 2009 to 2011 for eight states accounting for 68% of the Asian American population were analyzed. Race for cases with unknown subgroup was imputed using stratified proportion models by sex, age, cancer site and geographic regions. Age-standardized incidence rates were calculated for 17 cancer sites for the six largest Asian subgroups. Our analysis comprised 90,709 Asian and 1,327,727 non-Hispanic white cancer cases. Asian Americans had significantly lower overall cancer incidence rates than non-Hispanic whites (336.5 per 100,000 and 541.9 for men, 299.6 and 449.3 for women, respectively). Among specific Asian subgroups, Filipino men (377.4) and Japanese women (342.7) had the highest overall incidence rates while South Asian men (297.7) and Korean women (275.9) had the lowest. In comparison to non-Hispanic whites and other Asian subgroups, significantly higher risks were observed for colorectal cancer among Japanese, stomach cancer among Koreans, nasopharyngeal cancer among Chinese, thyroid cancer among Filipinos, and liver cancer among Vietnamese. South Asians had remarkably low lung cancer risk. Overall, Asian Americans have a lower cancer risk than non-Hispanic whites, except for nasopharyngeal, liver and stomach cancers. The unique portrayal of cancer incidence patterns among specific Asian subgroups in this study provides a new baseline for future cancer surveillance research and health policy.


The opinions expressed in this article are those of the authors and may not represent the official positions of NAACCR.

Copyright © 2018 NAACCR, Inc. All Rights Reserved | naaccr-swoosh-only See NAACCR Partners and Sponsors