NAACCReview

The devil is in the details: the power of cancer registry data for documenting breast cancer incidence trends and subtype patterns among distinct Asian American ethnic groups.


Scarlett Lin Gomez, PhD, Director, Greater Bay Area Cancer Registry, Cancer Prevention Institution of California (NAACCR Member)

Asian Americans are generally considered as one racial/ethnic group in federal, state, and local health statistics. Until recently, they have been lumped together with the Native Hawaiian and Pacific Islander classifications as one “Asian/Pacific Islander” category. In fact, the Asian American category is heterogeneous, comprising populations from nearly 30 countries, and differing widely in migration patterns, socioeconomic status, health behaviors, and culture, all of which contribute to differences in disease incidence. An increasing number of reports and publications of late have documented differences in risk factors and disease outcomes among distinct ethnic groups when the data are disaggregated. Cancer incidence is no exception, with thanks to the long legacy and commitment within the US cancer registries to collect detailed Asian American race/ethnicity data, we have been able to document cancer patterns for distinct ethnic groups, finding important differences to inform clinical, public health, and policy efforts.

We recently leveraged 26 years of data from the California Cancer Registry, which covers the state with the largest Asian American population in the US, to investigate breast cancer incidence trends among seven Asian American ethnic groups. Our findings included: continuing increases in rates of breast cancer among women from all seven Asian American ethnic groups, with the largest increases for South Asians, Vietnamese, and Southeast Asians – the most recently immigrated groups; rates among Japanese and Filipino women under age 50 comparable to those in non-Hispanic White women; increasing trends over time of distant stage disease, particularly among Filipino, Korean, and South Asian women; and higher rates of some types of HER2-overexpressing tumors among Filipino and Vietnamese women relative to non-Hispanic White women. These patterns warrant additional attention to public health prioritization of disparities in access to care, as well as further research in identifying relevant breast cancer risk factors.


Click here to view the article
Breast Cancer Research and Treatment


Abstract

Purpose: In contrast to other US racial/ethnic groups, Asian Americans (AA) have experienced steadily increasing breast cancer rates in recent decades. To better understand potential contributors to this increase, we examined incidence trends by age and stage among women from seven AA ethnic groups in California from 1988 to 2013, and incidence patterns by subtype

Methods: Joinpoint regression was applied to California Cancer Registry data to calculate annual percentage change (APC) for incidence trends. Incidence rate ratios were used to compare rates for AA ethnic groups relative to nonHispanic whites (NHW).

Results: All AA groups except Japanese experienced incidence increases, with the largest among Koreans in 1988–2006 (APC 4.7, 95% CI 3.8, 5.7) and Southeast Asians in 1988–2013 (APC 2.5, 95% CI 0.8, 4.2). Among women younger than age 50, large increases occurred for Vietnamese and other Southeast Asians; among women over age 50, increasing trends occurred in all AA ethnic groups. Rates increased for distant-stage disease among Filipinas (2.2% per year, 95% CI 0.4, 3.9). Compared to NHW, Filipinas and older Vietnamese had higher incidence rates of some HER2? subtypes

Conclusions: Breast cancer incidence rates have risen rapidly among California AA, with the greatest increases in Koreans and Southeast Asians. Culturally tailored efforts to increase awareness of and attention to breast cancer risk factors are needed. Given the relatively higher rates of HER2-overexpressing subtypes in some AA ethnicities, research including these groups and their potentially unique exposures may help elucidate disease etiology.


The opinions expressed in this article are those of the authors and may not represent the official positions of NAACCR.

Linkage of Indiana State Cancer Registry and Indiana Network for Patient Care Data


Laura P. Ruppert, MHA, Cancer Surveillance Section Director, Indiana State Cancer Registry
(NAACCR Steering Committee Chair)

As a central cancer registry, the Indiana State Cancer Registry (ISCR) is interested in supporting research, capture processes, and finding avenues to identify missing cases. In the surveillance community, we know there is information within electronic health records (EHR), that when linked with our data base, is able to provide a well-rounded picture of a cancer case, thus enhancing research efforts.

In terms of completeness of the ISCR, we like to say, we only know what we know! Over the years, linkages have provided real solutions for identification of missing cases. Some examples include linking with the Indiana Breast and Cervical Program, death data bases, etc. Nevertheless, we are always searching for ways to increase our efforts. A robust and complete ISCR database benefits Indiana and the nation so cancer control efforts can be applied appropriately.


Click here to view the article


Abstract


Background: Large automated electronic health records (EHRs), if brought together in a federated data model, have the potential to serve as valuable population-based tools in studying the patterns and effectiveness of treatment. The Indiana Network for Patient Care (INPC) is a unique federated EHR data repository that contains data collected from a large population across various health care settings throughout the state of Indiana. The INPC clinical data environment allows quick access and extraction of information from medical charts. The purpose of this project was to evaluate 2 differ-ent methods of record linkage between the Indiana State Cancer Registry (ISCR) and INPC, determine the match rate for linkage between the ISCR and INPC data for patients diagnosed with cancer, and to assess the completeness of the ISCR based on additional validated cancer cases identified in the INPC EHRs.

Methods: Deterministic and probabilistic algo-rithms were applied to link ISCR cases to the INPC. The linkage results were validated by manual review and the accuracy assessed with positive predictive value (PPV). Medical charts of melanoma and lung cancer cases identified in INPC but not linked to ISCR were manually reviewed to identify true incidence cancers missed by the ISCR, from which the com-pleteness of the ISCR was estimated for each cancer.

Results: Both deterministic and probabilistic approaches to linking ISCR and INPC had extremely high PPV (>99%) for identifying true matches for the overall cohort and each subcohort. The combined match rate for melanoma and lung cancer cases identified in the ISCR that matched to any patient occurrence in INPC (not by disease) was 85.5% for the complete cohort, 94.4% for melanoma, and 84.4% for lung cancer. The estimated completeness of capture by the ISCR was 84% for melanoma and 98% for lung cancer.

Conclusions: Cancer registries can be successfully linked to patients’ EHR data from institutions participating in a regional health information organization (RHIO) with a high match rate. A pragmatic approach to data linkage may apply both deterministic and probabilistic approaches together for the diverse purposes of cancer control research. The RHIO has the potential to add value to the state cancer registry through the identification of additional true incident cases, but more advanced approaches, such as natural language processing, are needed.

Key words: electronic health records, record linkage


The opinions expressed in this article are those of the authors and may not represent the official positions of NAACCR.

Years of Life and Productivity Loss from Potentially Avoidable Colorectal Cancer Deaths in U.S. Counties with Lower Educational Attainment (2008–2012)


Hannah K. Weir, Ph.D, Senior Epidemiologist, Centers for Disease Control and Prevention
(NAACCR Steering Committee Chair)

Colorectal cancer is a leading cause of premature death in the United States. This study reports that death rates from colorectal cancer have decreased in men and women in all socio-economic groups; however, large racial and socio-economic disparities persist. These disparities represent potentially avoidable premature deaths. Between 2008 and 2012, we estimated that of the 100,897 colorectal cancer deaths in residents of counties with lower-educational attainment, nearly 1 in 5 deaths may have been avoidable. These deaths resulted in nearly 2 billion dollars of lost productivity, annually.

Productivity losses due to premature cancer mortality are large and growing and, as this study has shown, disproportionately impact counties that are already economically disadvantaged, as these decedents are no longer contributing to the economic well being of their families or communities.


Click here to view the article
Downloaded from cebp.aacrjournals.org


Abstract

Years of Life and Productivity Loss from Potentially Avoidable Colorectal Cancer Deaths in U.S. Counties with Lower Educational Attainment (2008–2012)

Hannah K.Weir, Chunyu Li, S. Jane Henley, and Djenaba Joseph | Division of Cancer Prevention and Control, National Center for Chronic Disease Prevention and Health Promotion, Centers for Disease Control and Prevention, Atlanta, Georgia.

Background: Educational attainment (EA) is inversely associated with colorectal cancer risk. Colorectal cancer screening can save lives if precancerous polyps or early cancers are found and successfully treated. This study aims to estimate the potential productivity loss (PPL) and associated avoidable colorectal cancer–related deaths among screen-eligible adults residing in lower EA counties in the United States.

Methods: Mortality and population data were used to examine colorectal cancer deaths (2008–2012) among adults aged 50 to 74 years in lower EA counties, and to estimate the expected number of deaths using the mortality experience from high EA counties. Excess deaths (observed-expected) were used to estimate potential years life lost, and the human capital method was used to estimate PPL in 2012 U.S. dollars.

Results: County-level colorectal cancer death rates were inversely associated with county-level EA. Of the 100,857 colorectal cancer deaths in lower EA counties, we estimated that more than 21,000 (1 in 5) was potentially avoidable and resulted in nearly $2 billion annual productivity loss.

Conclusions: County-level EA disparities contribute to a large number of potentially avoidable colorectal cancer–related deaths. Increased prevention and improved screening potentially could decrease deaths and help reduce the associated economic burden in lower EA communities. Increased screening could further reduce deaths in all EA groups.

Impact: These results estimate the large economic impact of potentially avoidable colorectal cancer–related deaths in economically disadvantaged communities, as measured by lower

Cancer Epidemiol Biomarkers Prev; 26(5); 1–7. _2016 AACR.


The opinions expressed in this article are those of the authors and may not represent the official positions of NAACCR.

Annual Report to the Nation on the Status of Cancer, 1975-2014


Jiemin Ma, PHD, MHS, Strategic Director,
Surveillance and Health Services Research, American Cancer Society
(443) 804-7314; Jiemin.ma@cancer.org


On behalf of the ACS (this year’s lead agency), I’m pleased to announce that the latest Annual Report to the Nation on the status of cancer (ARN) was published on March 31, 2017. This is the 19th “edition” of ARN, which represents an annual collaborative effort by the ACS, CDC, NAACCR, and NCI. This would not have happened without the great inputs from each of the collaborators and the contributions of the state and regional cancer registry staff who collected the data.

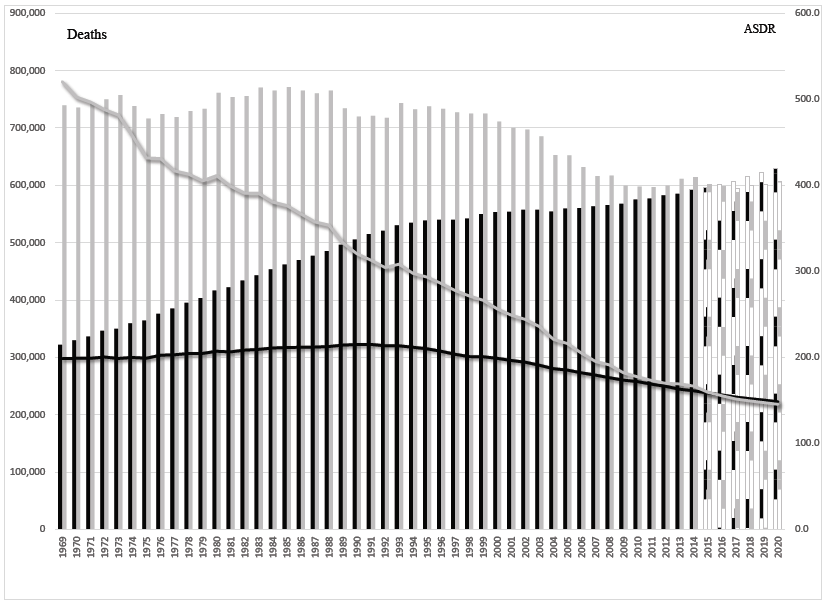
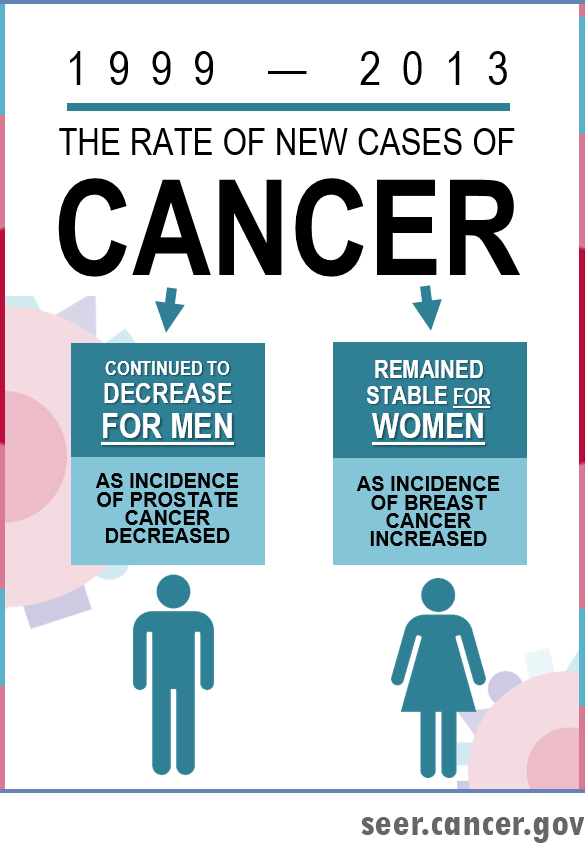
During 1999-2013, the overall cancer incidence rates continued to decrease among men and remained stable among women. The overall cancer death rates continued to decline during 2000-2014 among men, women, and children. The decreases in death rates are the continuation of trends over the past 20 years. Factors that have contributed to these decreasing trends include reduced tobacco use, improved early detection (e.g., colorectal, breast, and cervical cancer), and improved treatments for many cancers. In particular, due to public health policies against tobacco and increased awareness of the health hazards of smoking, adult smoking prevalence has decreased by over 50% over the past five decades. However, tobacco use still accounts for nearly one-third of cancer deaths in the U.S. and about 40 million of Americans still smoke. These facts underscore the need for expansion of tobacco control programs and the development of new strategies to accelerate the reduction in tobacco use.

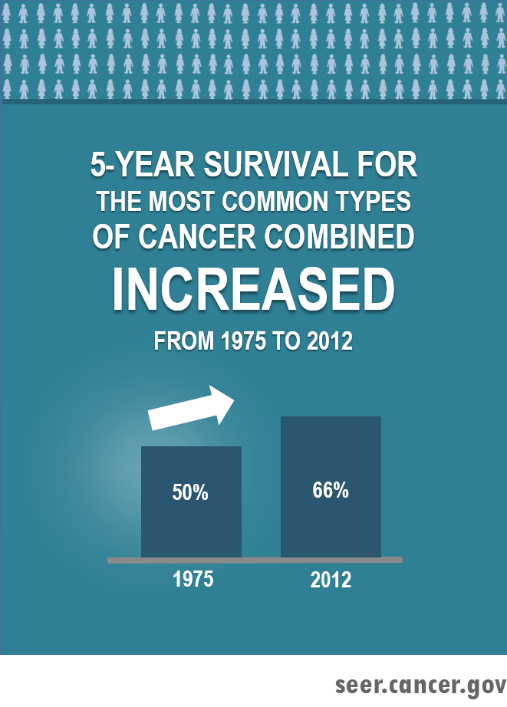
This year’s ARN features cancer survival. Reflected by a 16% absolute increase in 5-year relative survival from 1975-1977 to 2006-2012 for all cancers combined, the overall cancer survival has been improving over the past four decades. By cancer site, the greatest absolute increases in survival rate were found for cancers of the prostate, kidney, NHL, myeloma, and leukemia. Both advances in treatment and declines in surgical mortality may have contributed to the improvements in survival. However, no improvements in survival have been found for cancers of the cervix and uterus. Five-year relative survival remained low for some cancer sites such as pancreas (8.5%), liver (18.1%), lung (18.7%), and esophagus (20.5%).

Racial disparities in survival have persisted over time for many common cancers, although improved survival was found among both blacks and whites. In addition, cancer survival varied considerably across ethnic groups and states. For example, after adjusting for sex and age, the risk of death for all cancers combined was 33% (HR=1.33) higher in non-Hispanic blacks and 51% (HR=1.51) higher in non-Hispanic American Indians/Alaska Natives compared with non-Hispanic whites. These findings remind us that more efforts should be made to discover new strategies for prevention, early detection, and treatment and to apply proven interventions broadly and equitably.


Click here to view the report

Press Release | FAQ | Contact Us


Abstract

Background
The American Cancer Society (ACS), the Centers for Disease Control and Prevention (CDC), the National Cancer Institute (NCI), and the North American Association of Central Cancer Registries (NAACCR) collaborate to provide annual updates on cancer occurrence and trends in the United States. This Annual Report highlights survival rates.

Methods
Data were from the CDC- and NCI-funded population-based cancer registry programs and compiled by NAACCR. Trends in age-standardized incidence and death rates for all cancers combined and for the leading cancer types by sex were estimated by joinpoint analysis and expressed as annual percent change. We used relative survival ratios and adjusted relative risk of death after a diagnosis of cancer (hazard ratios [HRs]) using Cox regression model to examine changes or differences in survival over time and by sociodemographic factors.

Results
Overall cancer death rates from 2010 to 2014 decreased by 1.8% (95% confidence interval [CI] = –1.8 to –1.8) per year in men, by 1.4% (95% CI = –1.4 to –1.3) per year in women, and by 1.6% (95% CI = –2.0 to –1.3) per year in children. Death rates decreased for 11 of the 16 most common cancer types in men and for 13 of the 18 most common cancer types in women, including lung, colorectal, female breast, and prostate, whereas death rates increased for liver (men and women), pancreas (men), brain (men), and uterine cancers. In contrast, overall incidence rates from 2009 to 2013 decreased by 2.3% (95% CI = –3.1 to –1.4) per year in men but stabilized in women. For several but not all cancer types, survival statistically significantly improved over time for both early and late-stage diseases. Between 1975 and 1977, and 2006 and 2012, for example, five-year relative survival for distant-stage disease statistically significantly increased from 18.7% (95% CI = 16.9% to 20.6%) to 33.6% (95% CI = 32.2% to 35.0%) for female breast cancer but not for liver cancer (from 1.1%, 95% CI = 0.3% to 2.9%, to 2.3%, 95% CI = 1.6% to 3.2%). Survival varied by race/ethnicity and state. For example, the adjusted relative risk of death for all cancers combined was 33% (HR = 1.33, 95% CI = 1.32 to 1.34) higher in non-Hispanic blacks and 51% (HR = 1.51, 95% CI = 1.46 to 1.56) higher in non-Hispanic American Indian/Alaska Native compared with non-Hispanic whites.

Conclusion
Cancer death rates continue to decrease in the United States. However, progress in reducing death rates and improving survival is limited for several cancer types, underscoring the need for intensified efforts to discover new strategies for prevention, early detection, and treatment and to apply proven preventive measures broadly and equitably.


The opinions expressed in this article are those of the authors and may not represent the official positions of NAACCR.

Cancer Care Ontario adds new online tool for custom cancer statistics to its current suite of offerings

Zeinab El-Masri, MPH, Knowledge Dissemination & Evaluation Specialist, Surveillance and Ontario Cancer Registry


Cancer Care Ontario is excited to announce the recent launch of Ontario Cancer Profiles, a self-serve, interactive mapping tool that gives instant access to recent, customizable provincial and regional Ontario cancer statistics on cancer burden, risk factors, social determinants of health and screening indicators.

This launch marks the release of the first public tool of its kind by a cancer agency in Canada. Ontario Cancer Profiles was inspired by similar tools produced by other organizations, such as the International Agency for Research on Cancer’s Global Cancer Atlas and the US National Cancer Institute’s State Cancer Profiles.

The release of Ontario Cancer Profiles is being phased, whereby the current version—a dashboard style tool built by leveraging existing technology—will allow Cancer Care Ontario to identify additional user data needs and application enhancements. This information will be used to inform the approach for the second phase, which is intended to provide more comprehensive statistics and a refined user interface.

Cancer Care Ontario produces various knowledge products and tools to disseminate cancer surveillance, population health, and cancer screening information to its partners and stakeholders. Ontario Cancer Profiles is an important addition to the current suite of offerings, as it enables instant and open access to data through a one-stop shop for population-level, cancer-related  statistics. The information in this tool will enable stakeholders and partners to explore health equity measures as they relate to cancer incidence, mortality, screening, modifiable risk factors and social determinants of health to support targeted cancer control and prevention efforts in the province.

For more information and to access the tool, please visit cancercare.on.ca/ontariocancerprofiles. For any questions or to share your thoughts on this tool, please email surveillance@cancercare.on.ca.


About Cancer Care Ontario

CCO is the Ontario government’s principal advisor on the cancer and kidney care systems, as well as on access to care for key health services. Encompassing Cancer Care Ontario and the Ontario Renal Network, CCO drives continuous improvement in disease prevention and screening, the delivery of care and the patient experience for chronic diseases. It provides tools, resources and evidence-based information to help its healthcare partners improve the delivery of care.


The opinions expressed in this article are those of the authors and may not represent the official positions of NAACCR.

Future of Testicular Germ Cell Tumor Incidence in the United States: Forecast Through 2026


Armen Ghazarian, MPH Cancer Research Training Award Fellow, National Cancer Institute

Testicular germ cell tumors (TGCT) are the most commonly occurring malignancy among young men in the United States. As with most populations around the world, the incidence of TGCT is higher among white men than men of other racial/ethnic groups. A National Cancer Institute study team used NAACCR Cancer in North America (CiNA) data to forecast trends in testicular cancer incidence by race/ethnicity and by histologic subtype (seminoma, nonseminoma). They found that while TGCT incidence remains highest among white men, rates are increasing most rapidly among Hispanic men. Within the next decade, TGCT incidence rates among Hispanic men are expected to surpass the rates among white men because of increases in both seminoma and nonseminoma. Reasons for the increase among Hispanics are unclear, but could possibly be related to place of birth, unidentified environmental exposures, country of ancestry, and/or length of residence in the United States according to Armen Ghazarian, one of the study authors.


Read Full Article


Abstract

Background
Testicular germ cell tumors (TGCTs) are rare tumors in the general population but are the most commonly occurring malignancy among males between ages 15 and 44 years in the United States (US). Although non-Hispanic whites (NHWs) have the highest incidence in the US, rates among Hispanics have increased the most in recent years. To forecast what these incidence rates may be in the future, an analysis of TGCT incidence in the Surveillance, Epidemiology, and End Results program and the National Pro-gram of Cancer Registries was conducted.

Methods
TGCT incidence data among males ages 15 to 59 years for the years 1999 to 2012 were obtained from 39 US cancer registries. Incidence rates through 2026 were forecast using age-period-cohort models strati-fied by race/ethnicity, histology (seminoma, nonseminoma), and age.

Results
Between 1999 and 2012, TGCT incidence rates, both overall and by histology, were highest among NHWs, followed by Hispanics, Asian/Pacific Islanders, and non-Hispanic blacks. Between 2013 and 2026, rates among Hispanics were forecast to increase annually by 3.96% (95% confidence interval, 3.88%-4.03%), resulting in the highest rate of increase of any racial/ethnic group. By 2026, the highest TGCT rates in the US will be among Hispanics because of increases in both seminomas and nonseminomas. Rates among NHWs will slightly increase, whereas rates among other groups will slightly decrease.

Conclusion
By 2026, Hispanics will have the highest rate of TGCT of any racial/ethnic group in the US because of the rising incidence among recent birth cohorts. Reasons for the increase in younger Hispanics merit further exploration. Cancer 2017;000:000-000. Published 2017. This article is a U.S. Government work and is in the public domain in the USA.

Keywords

Incidence, ethnic groups, North American Association of Central Cancer Registries (NAACCR), testicular cancer, testicu-lar gem cell tumor (TGCT), trends.


The opinions expressed in this article are those of the authors and may not represent the official positions of NAACCR.

Finding “Zombies” in Your Database by Confirming Vital Status


David K. O’Brien, PhD, GISP
Alaska Cancer Registry, Department of Health and Social Services, Anchorage, AK
Email: david.obrien@alaska.gov, phone: 907-344-5874


Objective

The Alaska Cancer Registry (ACR) conducted a study in 2015 to identify and correct the vital status of certain cases in its database. These cases were reported as deceased by the original healthcare facility but were not identified as being deceased using routine death resources. Cases incorrectly reported as deceased are referred to as “Zombies.”

Background

Cancer registry databases must have accurate vital status information on their cancer cases. This is important for:

  • Cancer survival analysis
  • Cancer control planning
  • Studies on the outcomes of cancer care
  • Patient follow-back & cancer research studies requiring patient contact

There are several ways cancer registries passively determine the vital status of their cancer cases. This involves linking their database with mortality databases:

  • State mortality database (SMD): Works well for current state residents
  • Social Security Death Index (SSDI): Works well for former state residents who moved to another state, but does not list the cause of death
  • National Death Index (NDI): Works well for former state residents who moved to another state, and includes the cause of death

However, not all deaths are discoverable using these 3 mortality databases due to various factors:

  • People who died out-of-country as a resident of another country will have no state death certificate (usually for foreign-born cases)
  • In-state deaths that were never reported to the state will have no state death certificate
  • Decedents who never qualified for social security will not be in the SSDI
  • Deaths reported late to the state after NDI closes its current death year will never be added to the NDI

Another way cancer registries receive vital status information is from the hospital/healthcare provider that originally reported the case to the cancer registry. The source of that information could be:

  • Copy of death certificate
  • Note from primary physician
  • Follow-up with primary physician
  • Obituary search
  • OR… a typographical error!

Cancer registry cases not linking to SMD, SSDI, or NDI fall into four categories:

  • Truly alive
  • Truly dead as indicated by additional information obtained by the healthcare provider
  • “Immortals”: Reported as alive but are really dead – forever living in the registry
  • “Zombies”: Reported as dead but are really alive – the undead!

Therefore, “Zombies” are cases that were improperly reported as deceased by the original healthcare source and are identified as being alive by consulting additional resources. ACR wanted to identify Zombie candidates in its database, research them, and correct the vital status of those cases that were determined to be true Zombies.

Methods

ACR links its cancer cases annually against the SMD, SSDI, and NDI to determine the current case vital status. After the annual SMD death review in the spring of 2015, ACR identified Zombie candidates by checking all its deceased cases that had never linked to SMD, SSDI, and NDI in the past. Zombie candidates were reassessed after linking with SSDI in the summer and NDI in the fall.

The remaining Zombie candidates were manually reviewed using the Alaska Permanent Fund Dividend (PFD) applicant database. If an individual continued to file PFD applications for several years after their date of death, then they were assumed to be still alive. The state PFD Division reviews all the applications for potential fraud, so the PFD database is considered to be highly reliable. If the individual was not in the PFD database, then they were looked up in the Alaska State Police (Troopers) database, which is linked to the Alaska Department of Motor Vehicles. If the individual had filed for a driver’s license after their date of death, they were assumed to be still alive.

Results

After the initial SMD linkage, 85 potential Zombie cases were discovered (0.2% of the total cases in the database). Of these, 44 (51.2%) were reported to ACR by other central cancer registries, most of them from other state health departments. After the SSDI linkage, 50 cases were verified as deceased, and after the NDI linkage, 15 more cases were verified as deceased. Only 20 potential Zombie cases remained for manual review.

After manual review of the 20 cases using the PFD and Troopers databases, 14 cases (70%) were determined to be true Zombies and verified as alive. Their vital status was changed to alive in the ACR database. The remaining 6 cases were verified as deceased:

  • 3 died out-of-country; death information was documented in the original report from the healthcare facility
  • 2 died in-state with no death certificate; death information was documented in the original report from the healthcare facility
  • 1 died out-of-state; death information verified by that state’s cancer registry

The study results are summarized in the following table:


Type of Case # of Cases
Potential Zombie cases discovered after death clearance 85 Total
     Resolved by SSDI linkage 50
     Further resolved by NDI linkage 15
     Potential Zombie cases remaining 20
Potential Zombie cases for manual review 20 Total
     True Zombie cases, confirmed alive, changed vital status 14
     Died out of country 3
     Died in state 2
     OOS source record 1

Discussion

ACR manually reviewed 20 cases for this study; 70% of them turned out to be true Zombie cases and had their vital status changed from dead to alive. But Alaska has one of the smallest annual cancer caseloads in the country at about 3,000 cases per year. The annual caseloads for most of the other states are much higher, especially for the most populous states of NY, TX, FL, and CA with over 100,000 cancer cases per year and potentially over 1,000 Zombie candidates. It could take a considerable effort to do this type of study in a state with a large population.

This is not just a problem specific to cancer registry databases. This also affects any other database that includes the vital status of a person, such as another type of healthcare database, law enforcement, or a financial institution. We have probably all heard stories of a person who couldn’t access their finances because the bank thought they had died. Other organizations would benefit from this type of review if the vital status of the people in their database is important for that organization.


The opinions expressed in this article are those of the authors and may not represent the official positions of NAACCR.

Resource requirements for cancer registration in areas with limited resources: Analysis of cost data from four low- and middle-income countries


Florence Tangka, PhD, Health Economist,
Centers for Disease Control and Prevention

Cost of Cancer Registration in Limited Resource Settings

Cancer is a leading cause of illness and deaths worldwide. In 2012 approximately 14.1 million new cancer cases were diagnosed, 8.2 million people died from cancer, and 32.5 million people were living with cancer. More than 50% of the world’s cancer cases and 65% of cancer deaths occur in limited-resource settings, and more than 48% of cancer survivors live in these areas. In the next two decades, new cancer cases are projected to increase by 70% worldwide, mostly in limited-resource settings.

High-quality population-based cancer surveillance data are needed to describe cancer burden, patterns, and outcomes in order to inform cancer prevention, detection and control activities, and evaluate interventions so that the best approaches to ease burden and suffering are adopted.  There are large inequalities in the existence, coverage, and quality of cancer surveillance systems across the world, with limited information available in limited-resource settings. For example, the percentage of the population covered by cancer registries ranges from nearly 100% in North America to less than 10% in Asia, Central America, and South America, and roughly 2% in Africa (See Figure 1).

Only one in five countries in limited-resource settings have the data needed to inform cancer control plans. To address this gap, the International Agency for Research on Cancer (IARC), a specialized agency of World Health Organization (WHO), has initiated the Global Initiative for Cancer Registry Development (GICR) to establish regional resource centers to provide technical support and guidance for the development and improvement of population-based cancer registries around the world.

IARC has developed a framework for planning and implementing population-based cancer registries. However, lack of information about how much registries cost is a major barrier to planning, implementing, and evaluating cancer registration. Yet, investing in high quality surveillance data is crucial so countries can select the best interventions that are both cost effective and most improve health.

CDC, RTI International and others partner developed a tool and used it to collect standardized cost and resource data from 11 registries in Colombia, India, Kenya, Barbados, and Uganda.  Findings from this study have been published as a series of manuscripts in Cancer Epidemiology.  The study found that partnerships are crucial to developing and sustaining registries. While registries can be expensive, they are less expensive in LMICs and the population level cost is low (less than $0.01 to $0.22 per person). Efficient data collection processes and organizations can cut costs further.

Click to enlarge


Information on the cost of establishing, improving, maintaining, and expanding cancer registries is essential to ensure adequate funding is available for cancer registration activities. Accurate and reliable costing data is also critical in supporting country-level and regional efforts to plan, implement and evaluate investments in cancer registration.

The abstract below is from the comparative paper published in the Monograph titled “Resource requirements for cancer registration in areas with limited resources: Analysis of cost data from four low- and middle-income countries.”


Resource requirements for cancer registration in areas with limited resources: Analysis of cost data from four low- and middle-income countries (The abstract below is from The International Journal of Cancer Epidemiology, Detection and Prevention)


Abstract

Background
The key aims of this study were to identify sources of support for cancer registry activities, to quantify resource use and estimate costs to operate registries in low- and middle-income countries (LMIC) at different stages of development across three continents.

Methods
Using the Centers for Disease Control and Prevention’s (CDC’s) International Registry Costing Tool (IntRegCosting Tool), cost and resource use data were collected from eight population-based cancer registries, including one in a low-income country (Uganda [Kampala)]), two in lower to middle-income countries (Kenya [Nairobi] and India [Mumbai]), and five in an upper to middle-income country (Colombia [Pasto, Barranquilla, Bucaramanga, Manizales and Cali cancer registries]).

Results
Host institution contributions accounted for 30%–70% of total investment in cancer registry activities. Cancer registration involves substantial fixed cost and labor. Labor accounts for more than 50% of all expenditures across all registries. The cost per cancer case registered in low-income and lower- middle-income countries ranged from US $3.77 to US $15.62 (United States dollars). In Colombia, an upper to middle-income country, the cost per case registered ranged from US $41.28 to US $113.39. Registries serving large populations (over 15 million inhabitants) had a lower cost per inhabitant (less than US $0.01 in Mumbai, India) than registries serving small populations (under 500,000 inhabitants) [US $0.22] in Pasto, Colombia.

Conclusion
This study estimates the total cost and resources used for cancer registration across several countries in the limited-resource setting, and provides cancer registration stakeholders and registries-with opportunities to identify cost savings and efficiency improvements. Our results suggest that cancer registration involve substantial fixed costs and labor, and that partnership with other institutions is critical for the operation and sustainability of cancer registries in limited resource settings. Although we included registries from a variety of limited-resource areas, information from eight registries in four countries may not be large enough to capture all the potential differences among the registries in limited-resource settings.


The opinions expressed in this article are those of the authors and may not represent the official positions of NAACCR.

Black Heterogeneity in Cancer Mortality: US-Blacks, Haitians, and Jamaicans

paulo-pinheiro
Paulo Pinheiro, MD, MSc, PhD, Associate Professor Epidemiology, University of Nevada Las Vegas (NAACCR Committee Member)

Significant disparities between Blacks, or Americans of African descent, and the majority non-Hispanic white population for cancer incidence, survival and mortality are well-documented. For research purposes, Blacks have been typically aggregated as one large population group, as NAACCR does not collect specific information on descent for non-Hispanic Blacks. However, our colleagues at the University of Nevada Las Vegas ​(UNLV) ​used mortality data from Florida to examine heterogeneity within the Black population, finding surprising differences between US-born Blacks, ​and Jamaicans and Haitians​ (Afro-Caribbean populations) residing in Florida​.

US-born Blacks had exceedingly high mortality rates, nearly double that of their Caribbean counterparts, whose rates were similar to or lower than non-Hispanic whites for many cancers. Haitians in Florida had the lowest mortality for all cancers combined and for the greatest causes of cancer mortality: lung, colorectal, breast, and prostate; Jamaican rates were intermediate between Haitian and US-born Black rates. Perhaps most surprising is that even for infection-related cancers, typically ascribed to immigrant populations, US-born Black men had higher mortality for liver and stomach cancer, and US-born Black women had higher cervical cancer mortality than Jamaicans or Haitians.​ Also, the patterns among Jamaicans and Haitians in the US vary according to cancer site, and these patterns are not always compatible with the widely known “healthy immigrant effect”.​

These results assume great importance for aggregated rates in states such as New York and Florida with significant diversity in the Black population, as the inclusion of these relatively healthier populations has the effect of pulling down the rates and underestimating the true mortality burden for US-born Blacks, shown here to be even worse than previously documented. This work also highlights the importance of better understanding the role of acculturation among immigrant groups in cancer risk.


Read Full Article (Abstract below)


Abstract

Introduction: The quantitative intraracial burden of cancer incidence, survival and mortality within black populations in the United States is virtually unknown.

Methods: We computed cancer mortality rates of US- and Caribbean-born residents of Florida, specifically focusing on black populations (United States, Haiti, Jamaica) and compared them using age-adjusted mortality ratios obtained from Poisson regression models. We compared the mortality of Haitians and Jamaicans residing in Florida to populations in their countries of origin using Globocan.

Results: We analyzed 185,113 cancer deaths from 2008 to 2012, of which 20,312 occurred in black populations. The overall risk of death from cancer was 2.1 (95% CI: 1.97–2.17) and 1.6 (95% CI: 1.55–1.71) times higher for US-born blacks than black Caribbean men and women, respectively (P < .001).

Conclusions: Race alone is not a determinant of cancer mortality. Among all analyzed races and ethnicities, including Whites and Hispanics, US-born blacks had the highest mortality rates while black Caribbeans had the lowest. The biggest intraracial difference was observed for lung cancer, for which US-blacks had nearly 4 times greater mortality risk than black Caribbeans. Migration from the islands of Haiti and Jamaica to Florida resulted in lower cancer mortality for most cancers including cervical, stomach, and prostate, but increased or stable mortality for 2 obesity-related cancers, colorectal and endometrial cancers. Mortality results in Florida suggest that US-born blacks have the highest incidence rate of “aggressive” prostate cancer in the world, rather than Caribbean men.


The opinions expressed in this article are those of the authors and may not represent the official positions of NAACCR.

Heart Disease and Cancer Deaths — Trends and Projections in the United States, 1969–2020


Hannah K. Weir, Ph.D, Senior Epidemiologist, Centers for Disease Control and Prevention
(NAACCR Steering Committee Chair)

Heart disease and cancer are the first and second leading causes of death in the United States. Age-standardized death rates (risk) have declined since the 1960s for heart disease and for cancer since the 1990s, whereas the overall number of heart disease deaths declined and cancer deaths increased. We analyzed mortality data to evaluate and project the effect of risk reduction, population growth, and aging on the number of heart disease and cancer deaths to the year 2020.

We used mortality data, population estimates, and population projections to estimate and predict heart disease and cancer deaths from 1969 through 2020 and to apportion changes in deaths resulting from population risk, growth, and aging.

We predicted that from 1969 through 2020, the number of heart disease deaths would decrease 21.3% among men (–73.9% risk,17.9% growth, 34.7% aging) and 13.4% among women (–73.3% risk, 17.1% growth, 42.8% aging) while the number of cancer deaths would increase 91.1% among men (–33.5% risk, 45.6% growth, 79.0% aging) and 101.1% among women (–23.8% risk,48.8% growth, 76.0% aging). We predicted that cancer would become the leading cause of death around 2016, although sex-specific crossover years varied.

Age-standardized death rates (ASDR) and the observed (solid) and predicted (hatched) deaths from cancer (dark gray) and heart disease (light gray) between 1969 and 2020 for men and women combined.

Heart Disease and Cancer Deaths — Trends and Projections in the United States, 1969–2020

Risk of death declined more steeply for heart disease than cancer, offset the increase in heart disease deaths, and partially offset the increase in cancer deaths resulting from demographic changes over the past 4 decades. If current trends continue, cancer will become the leading cause of death by 2020.


Click here to view the article


Hannah K. Weir, Robert N. Anderson, Sallyann M. Coleman King, Ashwini Soman, Trevor D. Thompson, Yuling Hong, Bjorn Moller, Steven Leadbetter

Centers for Disease Control and Prevention and the Cancer Registry of Norway.


The opinions expressed in this article are those of the authors and may not represent the official positions of NAACCR.

Copyright © 2018 NAACCR, Inc. All Rights Reserved | naaccr-swoosh-only See NAACCR Partners and Sponsors